Investor Relations
Stock Exchange Listing
The issued ordinary shares of the Citizens Development Business Finance PLC are listed on the main board of the Colombo Stock Exchange.The unaudited Interim Financial Statements for the three quarters in the financial year 2013/14 have been submitted to the Colombo Stock Exchange within the stated 45 days period. The unaudited Interim Financial Statements for the final quarter was submitted to the Colombo Stock Exchange within the stated 60 days period.
The Audited Income Statement for the year ended 31st March 2014 and the Audited Balance Sheet of the Company as at 31st March 2014 will be submitted to the Colombo Stock Exchange within three months from the Balance Sheet date.
The stock exchange ticker symbol for Citizens Development Business Finance PLC is ‘CDB’. CDB voting shares are listed as CDB.N0000 and Non-voting shares are listed as CDB.X0000.
Compliance Report
The Company has complied with all the requirements of the Section 7.6 of the Listing Rules of the CSE on the contents of the Annual Report of a Listed Entity.The table given below provides the references to the relevant sections of the Annual Report with the page references of the required information.
| Rule No. | Disclosure Requirement | Section Reference |
| 7.6 (i) | Names of persons who held the positions of Directors during the financial year | Annual Report of the Board of Directors |
| 7.6 (ii) | Principal activities of the Entity and its Subsidiaries during the year and any changes therein | Notes to the Financial Statements - Reporting Entity Annual Report of the Board of Directors |
| 7.6 (iii) | The names and the number of shares held by the 20 largest holders of voting and non-voting shares and the percentage of such shares held |
Investor Relations |
| 7.6 (iv) | The public holding percentage | Investor Relations |
| 7.6 (v) | A statement of each Director’s holding and Chief Executive Officer’s holding in shares of the Entity at beginning and end of each financial year | Annual Report of the Board of Directors |
| 7.6 (vi) | Information pertaining to material foreseeable risk factors of the Entity | Risk Management |
| 7.6 (vii) | Details of material issues pertaining to employees and industrial relations of the Entity | Not applicable for the year as the Company did not encounter any situation of this nature which require disclosure |
| 7.6 (viii) | Extent, locations, valuations and the number of buildings of the Entity’s land holdings and investment properties | Notes to the Financial Statements (Notes 24 and 25) |
| 7.6 (ix) | Number of shares representing the Entity’s stated capital | Annual Report of the Board of Directors
Investor Relations |
| 7.6 (x) | A distribution schedule of the number of holders in each class of equity securities, and the percentage of their total holdings | Investor Relations |
| 7.6 (xi) | Ratios and market price information:
Equity Ratios Debt Any changes in credit rating |
Investor Relations
Investor Relations Investor Relations |
| 7.6 (xii) | Significant changes in the Entity’s or its Subsidiaries fixed assets and the market value of land, if the value differs substantially from the book value | Notes to the Financial Statements (Note 25) |
| 7.6 (xiii) | Details of funds raised through Public Issues, Rights Issues and Private Placements during the year | Investor Relations |
| 7.6 (xiv) | Information in respect of Employee Share Option Schemes and Employee Share Purchase Schemes | Notes to the Financial Statements [Note 19(h)] |
| 7.6 (xv) | Disclosures pertaining to Corporate Governance practices in terms of Rules 7.10.3, 7.10.5 c and 7.10.6 c of Section 7 of the Rules | Corporate Governance |
| 7.6 (xvi) | Disclosure on Related Party Transactions exceeding 10% of the Equity or 5% of the total assets of the Entity as per Audited Financial Statements, whichever is lower | Not applicable |
Investor Ratios
| 2013/14 | 2012/13 | 2011/12 | 2010/11 | 2009/10* | |
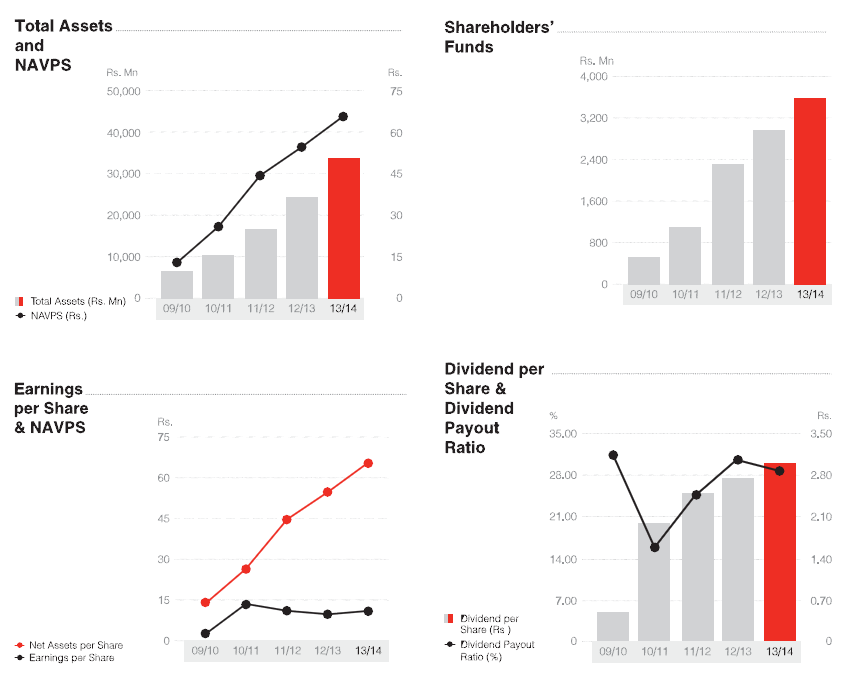
| Earnings per share (Rs.) | 10.33 | 9.01 | 10.28 | 12.76 | 1.60 |
| Net Assets per share (Rs.) | 65.87 | 54.60 | 44.31 | 25.83 | 12.93 |
| Return on equity (%) | 17.16 | 18.57 | 30.49 | 65.98 | 13.45 |
| Dividend per share (Rs.) | 3.00** | 2.75 | 2.50 | 2.00 | 0.50 |
| Dividend payout ratio (%) | 29.04 | 30.52 | 24.32 | 15.67 | 31.25 |
*Annualised figures for the fifteen months period ended 31st March 2010
**Proposed
Dividends
For the financial year ended 31st March 2013, CDB paid a cash dividend of Rupees Two and Cents Seventy Five (Rs 2.75) per share on both its 46,299,223 ordinary voting shares and 8,005,984 ordinary non-voting shares aggregating to a sum of Rupees One Hundred and Forty Nine Million Three Hundred and Thirty-Nine Thousand Three Hundred and Nineteen and Cents Twenty-Five only (Rs. 149,339,319.25/-) as the first and final dividend.
| 2013/14 | 2012/13 | 2011/12 | 2010/11 | |
| Final - Cash Dividend | 3.00* | 2.75 | 1.00 | 2.00 |
| Scrip Dividend | 1.50 | |||
| Total Dividend | 3.00* | 2.75 | 2.50 | 2.00 |
*Proposed dividend for this year would be a cash dividend of Rs. 3.00 per share which needs to be approved by the shareholders at the AGM.
Share Price Information
| Prices | Voting | Non-Voting | ||
| 2013/14 | 2012/13 | 2013/14 | 2012/13 | |
| Rs. | Rs. | Rs. | Rs. | |
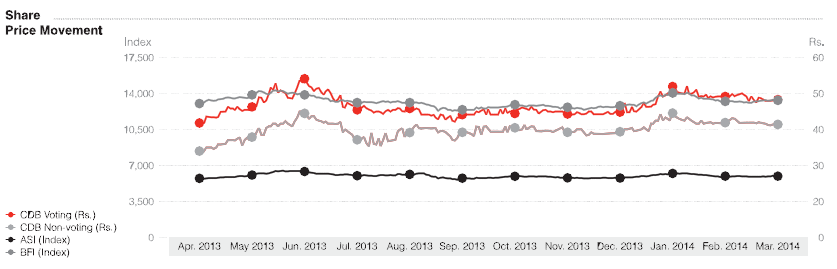
| High | 54.90 | 47.50 | 44.80 | 57.80 |
| Low | 38.00 | 29.00 | 28.00 | 26.60 |
| Last traded | 46.00 | 40.10 | 37.50 | 29.10 |
Market Capitalisation
| As at 31st March | 2013/14 | 2012/13 |
| Rs. | Rs. | |
| Voting | 2,129,764,258 | 1,856,598,842 |
| Non-Voting | 300,224,400 | 232,974,134 |
| Total | 2,429,988,658 | 2,089,572,976 |
Share Trading Information
| Annual Transaction Information | Ordinary - Voting Shares | |||
| 2013/14 | 2012/13 | 2011/12 | 2010/11 | |
| Transactions (Nos.) | 2,233 | 2,571 | 8,270 | 12,181 |
| Shares Traded (Nos.) | 2,522,678 | 2,497,811 | 12,303,772 | 12,318,200 |
| Value of Shares Traded (Rs.) | 113,669,908 | 98,920,592 | 983,554,597 | 934,191,580 |
| Annual Transaction Information | Ordinary - Non-Voting Shares | |||
| 2013/14 | 2012/13 | 2011/12 | 2010/11 | |
| Transactions (Nos.) | 1,595 | 2,139 | 1,685 | – |
| Shares Traded (Nos.) | 2,164,520 | 3,577,448 | 4,048,206 | – |
| Value of Shares Traded (Rs.) | 77,314,979 | 109,944,947 | 221,117,475 | – |
Quarterly Summary
| Period - Voting | High (Rs.) | Low (Rs.) | Close (Rs.) | Trade Volume | Share Volume | Turnover (Rs.) | Days Traded |
| 2013/14 - Q4 | 52.00 | 42.00 | 46.00 | 525 | 792,062 | 37,124,621 | 55 |
| 2013/14 - Q3 | 47.90 | 40.50 | 42.00 | 317 | 220,445 | 9,247,798 | 56 |
| 2013/14 - Q2 | 46.00 | 38.00 | 41.00 | 506 | 540,491 | 22,447,917 | 61 |
| 2013/14 - Q1 | 54.90 | 38.00 | 43.50 | 885 | 969,680 | 44,849,572 | 55 |
| Year | 54.90 | 38.00 | 46.00 | 2,233 | 2,522,678 | 113,669,908 | 227 |
| Period - Non-Voting | High (Rs.) | Low (Rs.) | Close (Rs.) | Trade Volume | Share Volume | Turnover (Rs.) | Days Traded |
| 2013/14 - Q4 | 44.80 | 30.10 | 37.50 | 367 | 374,206 | 14,416,263 | 48 |
| 2013/14 - Q3 | 37.70 | 34.00 | 35.60 | 152 | 508,094 | 17,464,840 | 41 |
| 2013/14 - Q2 | 38.00 | 30.00 | 35.30 | 345 | 358,614 | 12,186,349 | 52 |
| 2013/14 - Q1 | 43.10 | 28.00 | 35.00 | 731 | 923,606 | 33,247,527 | 60 |
| Year | 44.80 | 28.00 | 37.50 | 1,595 | 2,164,520 | 77,314,979 | 201 |
Shareholder Analysis
Ordinary Voting Shares - Composition According to Shareholding
| Shareholding Composition Voting | Resident | Non-Resident | Total | ||||||
| Shareholdings | Number of Shareholders |
No. of Shares | (%) | Number of Shareholders |
No. of Shares | (%) | Number of Shareholders |
No. of Shares | (%) |
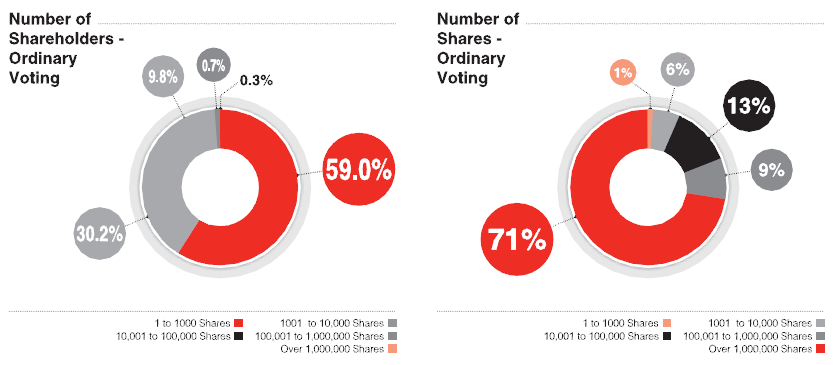
| 1 to 1000 Shares | 1,274 | 475,473 | 1.03 | 2 | 1,033 | 0 | 1,276 | 476,506 | 1.03 |
| 1001 to 10,000 Shares | 645 | 2,507,241 | 5.42 | 7 | 40,200 | 0.09 | 652 | 2,547,441 | 5.51 |
| 10,001 to 100,000 Shares | 209 | 5,690,793 | 12.29 | 3 | 104,172 | 0.22 | 212 | 5,794,965 | 12.51 |
| 100,001 to 1000,000 Shares | 15 | 3,425,443 | 7.40 | 1 | 543,073 | 1.17 | 16 | 3,968,516 | 8.57 |
| Over 1,000,000 Shares | 6 | 33,511,795 | 72.38 | – | – | – | 6 | 33,511,795 | 72.38 |
| 2,149 | 45,610,745 | 98.52 | 13 | 688,478 | 1.48 | 2,162 | 46,299,223 | 100.00 | |
Type of Shareholders
| Category of Shareholders - Voting | No. of Shareholders | No. of Shares |
| Individual | 2,085 | 9,361,967 |
| Institutional | 77 | 36,937,256 |
| Total | 2,162 | 46,299,223 |

Ordinary Non-Voting Shares - Composition According to Shareholding
| Shareholding Composition Voting | Resident | Non-Resident | Total | ||||||
| Shareholdings | Number of Shareholders |
No. of Shares | (%) | Number of Shareholders |
No. of Shares | (%) | Number of Shareholders |
No. of Shares | (%) |
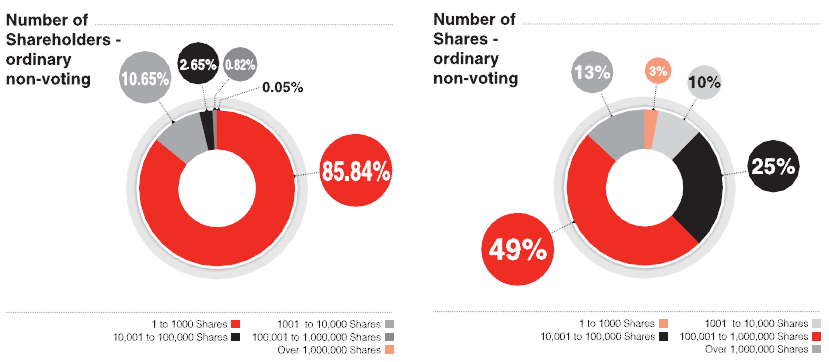
| 1 to 1,000 Shares | 1,776 | 235,043 | 2.94 | 6 | 1,562 | 0.02 | 1782 | 236,605 | 2.96 |
| 1,001 to 10,000 Shares | 219 | 764,843 | 9.55 | 2 | 9,000 | 0.11 | 221 | 773,843 | 9.66 |
| 10,001 to 100,000 Shares | 49 | 1,773,490 | 22.15 | 6 | 229,813 | 2.87 | 55 | 2,003,303 | 25.02 |
| 100,001 to 1000,000 Shares | 14 | 3,577,445 | 44.69 | 3 | 363,497 | 4.54 | 17 | 3,940,942 | 49.23 |
| Over 1,000,000 Shares | 1 | 1,051,291 | 13.13 | – | – | – | 1 | 1,051,291 | 13.13 |
| 2,059 | 7,402,112 | 92.46 | 17 | 603,872 | 7.54 | 2,076 | 8,005,984 | 100.00 | |
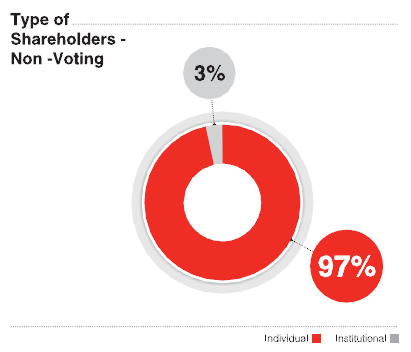
Type of Shareholders
| Category of Shareholders - Non-Voting | No. of Shareholders | No. of Shares |
| Individual | 2,006 | 3,678,233 |
| Institutional | 70 | 4,327,751 |
| Total | 2,076 | 8,005,984 |
Information on Share Capital Movement
| Year | Details | Share Type | Basis | No. of Shares Issued |
No. of Voting Shares (After Issue) |
No. of Non-Voting shares (After Issue) |
New Capital Raised (Rs.) |
| Prior to Introduction | Voting Shares | 39,685,048 | |||||
| 2010 | Introduction | 39,685,048 | |||||
| 2011 | Rights Issue | Voting Shares @ Rs. 70.00 | 1 for every 6 Voting shares | 6,614,175 | 46,299,223 | 462,992,250 | |
| Rights Issue | Non-Voting Shares @ Rs. 45.00 |
1 for every 7 Voting shares | 5,669,293 | 46,299,223 | 5,669,293 | 255,118,185 | |
| 2012 | Scrip Issue | Non-Voting Shares | 1 for every 22.222224 Voting shares & Non-Voting shares | 2,336,691 | 46,299,223 | 8,005,984 |
Major Shareholders
Ordinary Voting Shares - List of 20 Major Shareholders as at 31st March 2014
| No. | Name | Shareholding | Percentage (%) |
| 1. | Ceylinco Insurance PLC A/C No. 1 (Life Fund) | 14,642,163 | 31.63 |
| 2. | CDB ESOP Trust Fund (Pvt.) Limited | 12,500,000 | 27.00 |
| 3. | Ceylinco Insurance PLC A/C No. 2 (General Fund) | 1,853,287 | 4.00 |
| 4. | National Development Bank PLC/T.Senthilverl | 1,664,100 | 3.59 |
| 5. | Perpetual Capital (Pvt.) Limited | 1,602,245 | 3.46 |
| 6. | The Finance Company PLC A/C No. 1 | 1,250,000 | 2.70 |
| 7. | Asia Management Consultancy (Pvt.) Limited | 706,622 | 1.53 |
| 8. | Mr. D Kotthoff | 543,073 | 1.17 |
| 9. | E W Balasuriya & Co. (Pvt) Limited | 535,103 | 1.16 |
| 10. | Little Smile Organic (Pvt) Limited | 416,500 | 0.90 |
| 11. | MAS Capital (Pvt) Limited | 289,492 | 0.63 |
| 12. | East India Holding (Pvt) Limited | 243,833 | 0.53 |
| 13. | Mr. K Sabaratnam | 149,000 | 0.32 |
| 14. | Mr. W S R Fernando | 137,900 | 0.30 |
| 15. | Dr. C Gunasekara | 131,700 | 0.28 |
| 16. | Pan Asia Banking Corporation PLC/Mr. S M P L Jayaratne | 125,000 | 0.27 |
| 17. | Rev. J N Fernando | 125,000 | 0.27 |
| 18. | Mr. A M Subramanium & Mr. S Ragulan | 122,500 | 0.26 |
| 19. | Mrs. W M N Dabarera | 118,942 | 0.26 |
| 20. | Mr. M A H Esufally | 110,000 | 0.24 |
| Sub total of Top 20 Shareholders | 37,266,460 | 80.49 | |
| Others | 9,032,763 | 19.51 | |
| Total | 46,299,223 | 100.00 |
The percentage of shares held by the public as at 31st March 2014 is 36.93%.
Ordinary Non-Voting Shares - List of 20 Major Shareholders as at 31st March 2014
| No. | Name | Shareholding | Percentage (%) |
| 1. | J B Cocoshell (Pvt.) Limited | 1,051,291 | 13.13 |
| 2. | Deutsche Bank AG As Trustee For JB Vantage Value Equity Fund | 866,492 | 10.82 |
| 3. | CDB ESOP Trust Fund (Pvt.) Limited | 562,499 | 7.03 |
| 4. | Ceylinco Insurance PLC A/C No. 2 (General Fund) | 320,541 | 4.00 |
| 5. | Askold (Pvt.) Limited | 247,224 | 3.09 |
| 6. | Mr. M J Fernando | 208,999 | 2.61 |
| 7. | Mr. H N Esufally | 208,999 | 2.61 |
| 8. | E W Balasuriya & Co. (Pvt.) Limited | 204,413 | 2.55 |
| 9. | Mr. M A H Esufally | 194,000 | 2.42 |
| 10. | Mr. G H I Jafferjee | 156,749 | 1.96 |
| 11. | Mr. I M Dabah | 154,499 | 1.93 |
| 12. | Mr. S Prabagar | 142,235 | 1.78 |
| 13. | Commercial Bank of Ceylon PLC A/C No. 04 | 123,950 | 1.55 |
| 14. | Mr. S R Fernando | 120,000 | 1.50 |
| 15. | Captain M A L Ratnayake | 116,845 | 1.46 |
| 16. | Mr. M A Valabji | 104,499 | 1.31 |
| 17. | Jafferjees Investments (Pvt.) Limited | 104,499 | 1.31 |
| 18. | Gold Investment Limited | 104,499 | 1.31 |
| 19. | Trading Partners (Pvt.) Limited | 100,000 | 1.25 |
| 20. | Mrs. S E Lokhandwalla | 88,000 | 1.10 |
| Sub total of Top 20 Shareholders | 5,180,233 | 64.70 | |
| Others | 2,825,751 | 35.30 | |
| Total | 8,005,984 | 100.00 |
The percentage of shares held by the public as at 31st March 2014 is 75.15%.
Debenture Information
CDB managed to successfully conduct a Rs. 1 Bn Listed Debenture Issue in December 2013 which was oversubscribed on the opening day itself. The issue comprised of 5,000,000 Subordinated Listed Rated Unsecured Redeemable Five year Debentures with an option to issue up to a further 5,000,000 debentures in the event of an over subscription of initial 5,000,000 debentures. The objectives of the issue were to finance the Company’s anticipated future business growth in lending portfolio of leases, hire purchase and other loans and to reduce the asset and liability mismatch of the company. This issue will also help to strengthen the Tier 2 capital base of the company in order to maintain a healthy capital adequacy ratio. The Debentures are assigned a rating of BBB - by Lanka Ratings Agency Limited (‘LRA’).
Listed Debentures
| Listing | Debenture Description | Type | Interest Payment Frequency | Tenor | Issued Quantity as at 31.03.2014 |
Interest Rates | Comparable Government Security Yield |
|
| (Years) | Coupon Rate (per annum) (%) |
Annual Effective Rate (%) |
||||||
| Listed Debentures (Rs. 100) | Subordinated Listed Rated Unsecured Redeemable Debentures December 2013 - December 2018* | A | Annually | 5 | 6,653,600 | 16.00 | 16.00 | 8.65** |
| B | Semi-annually | 5 | 3,103,600 | 15.50 | 16.10 | 8.65** | ||
| C | Quarterly | 5 | 242,800 | 15.00 | 15.87 | 8.65** | ||
*Debentures have not been traded up to 31st March 2014. Therefore market price or yield information is not provided.
**Excluding 10% withholding tax
Unlisted Debentures
| Issue Type | Purpose | Type* | Total Value | Issued Date | Tenure | Investor | Balance as at 31.03.2014 |
| Rs. Mn | (Months) | Rs. Mn | |||||
| Rated Unsecured Redeemable Unlisted Debentures | To raise medium-term funds to expand the Company’s credit and leasing portfolios | Type III | 62.50 | 30.12.2010 | 42 | Ceylinco Insurance PLC - Life |
62.50 |
| Type IV | 62.50 | 30.12. 2010 | 48 | Ceylinco Insurance PLC - Life |
62.50 |
*The debentures are rated BBB by RAM Ratings Lanka (Pvt) Limited.
Proceeds of the debentures have been utilised for the intended purpose of the debenture issue.
Ratios
| 2013/14 | ||
| Debt/Equity Ratio | 55% | |
| Quick Asset Ratio (Times) | 0.81 | |
| Interest Cover (Times) | 1.20 |