| Financial |
| Key Performance Indicators | 2013/14 | 2012/13 |
| Results For the Year Rs. Mn. | ||
| Gross Income | 6,125 | 4,311 |
| Net Interest Income | 2,342 | 1,700 |
| Profit Before Vat & Tax | 783 | 665 |
| Profit Before Tax | 730 | 624 |
| Provision For Tax | 169 | 135 |
| Profit After Tax | 561 | 489 |
| Position at the Year End Rs. Mn. | ||
| Shareholders’ Funds | 3,577 | 2,965 |
| Deposits from Customers | 24,518 | 17,771 |
| Loans & Advances | 25,724 | 19,451 |
| Total Assets | 33,769 | 24,454 |
| Financial Ratios | ||
| Net Assets Value Per Share (Rs.) | 65.87 | 54.60 |
| Earnings Per Share (Rs.) | 10.33 | 9.01 |
| Return on Average Assets (%) | 2.51 | 3.04 |
| Return on Average Shareholders’ Funds (%) | 17.16 | 18.57 |
| Non-Performing Advances Ratio | ||
| Gross % | 5.19 | 2.32 |
| Net % | 2.73 | 1.27 |
| Statutory Ratios | ||
| Capital Adequacy (%) | ||
| Tier I (Minimum Requirement - 5%) | 12.61 | 14.32 |
| Tier I & II (Minimum Requirement - 10%) | 16.00 | 14.32 |
| Liquidity Ratio (%) | 18.60 | 14.49 |
The business recorded a strong growth in most of its key performance indicators with significant improvements in core profitability
| Non-Financial |
 |
| Operational |
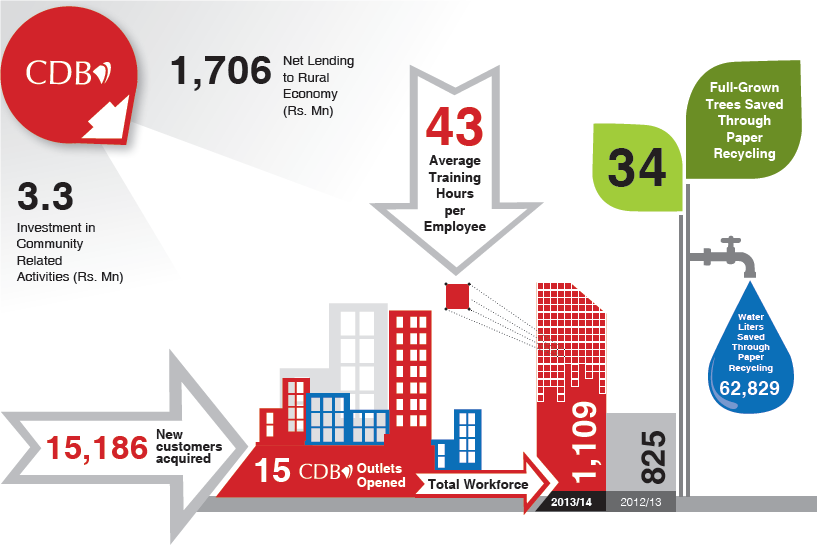
New Outlets Opened CDB enhanced its reach by opening 15 outlets during the year increasing the total number of outlets to 59 island-wide. |
Foreign Funding CDB acquired the first foreign funding line worth $ 6 Mn from Belgian Investment Company for Developing Countries (BIO). |
Debenture Issue Issue of ten million debentures at Rs. 100/- each which was over-subscribed with applications exceeding Rs. 1 Bn. |
New Corporate Office Commenced construction of our new corporate office. |